Every academic year, Career Services host a series of career fairs to connect students with employers across a wide range of industries. Here you'll find key statistics highlighting employer participation, student attendance and other information reflecting the growing impact and reach of these events.
If you’re interested in attending our next University Career + Internship Fair click to learn more:
*spacer*
Fall 2026 Fairs 1268
Fall 2026 Fairs
University Career & Internship Fair (UCIF) Overview
University Career & Internship Fair (UCIF) Overview
The University Career & Internship Fair is the largest career event of the fall semester. Held over the course of four days, the fair is organized by specific career fields to help students connect with employers in their areas of interest. Here you'll find key information about the entire event as well as day-specific statistics.
September 17-24, 2026 | Nebraska Unions
345 unique organizations
435 total organization booths
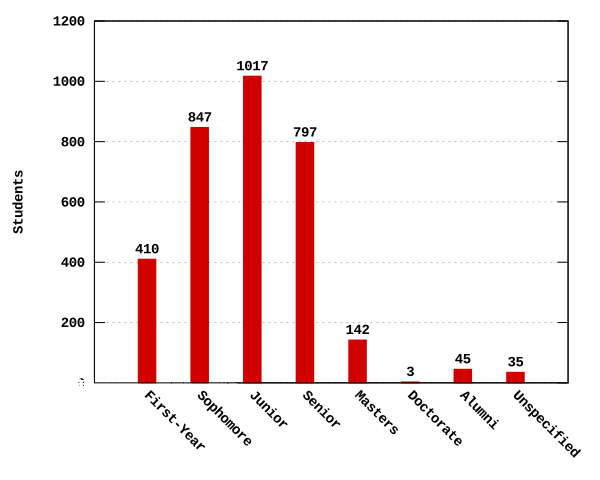
3,393 unique student attendees
3,949 total student attendees
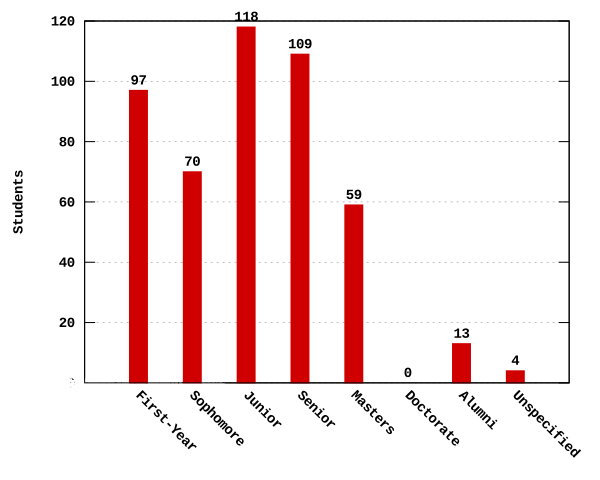
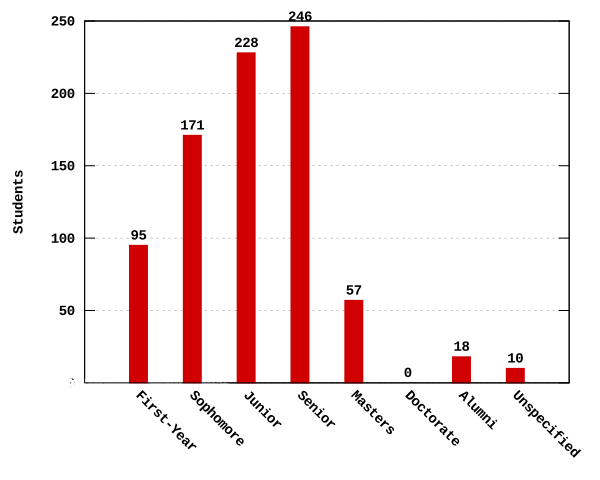
| 
| 
|
Organizations | Years | Colleges |
UCIF Day 1: Agriculture & Food Systems | Environment & Natural Resources
UCIF Day 2: Construction, Infrastructure & Engineering Technology | Computing, Software & Data Analytics
UCIF Day 3: Engineering | Science, Research & Development
UCIF Day 4: Business & Communications | Public Service & Community
UCIF Day 1
University Career & Internship Fair (UCIF) - DAY 1 of 4
Day 1 highlights agriculture and food systems, as well as environment and natural resource fields. Below are key statistics from the first day of the fair.

Thursday, September 17, 2026
11am-3 pm | Nebraska East Union
EMPLOYERS
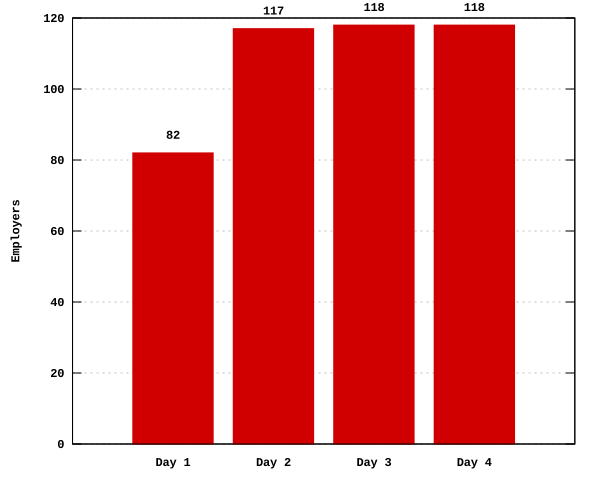
Attendance: 82 organizations
STUDENTS
Attendance: 470 students
Top majors:
- Agribusiness (23.2%)
- Animal Science (20.4%)
- Agronomy (8.5%)
UCIF Day 2
University Career & Internship Fair (UCIF) - DAY 2 of 4
Day 2 highlights architecture, engineering, and construction, as well as computing, software, and data analytics. Below are key statistics from the second day of the fair.

Tuesday, September 22, 2026
11am-3 pm | Nebraska Union
EMPLOYERS
Attendance: 117 organizations
STUDENTS
Attendance: 825 students
Top majors:
- Construction Management (26%)
- Computer Science (10%)
- Software Engineering (9.1%)
UCIF Day 3
University Career & Internship Fair (UCIF) - DAY 3 of 4
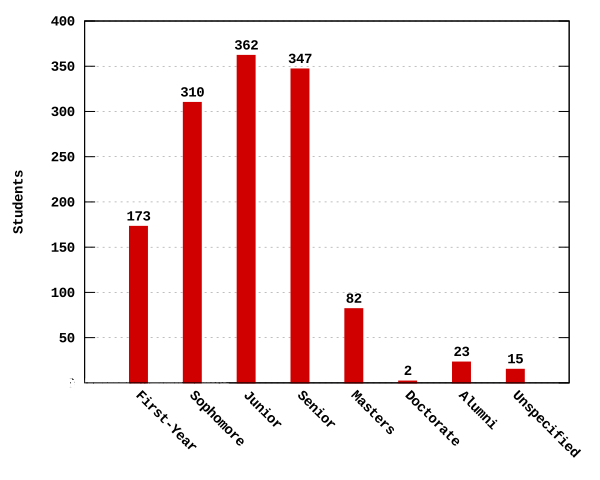
Day 3 highlights engineering, as well as science and research fields. Below are key statistics from the third day of the fair.

Wednesday, September 23, 2026
11am-3 pm | Nebraska Union
EMPLOYERS
Attendance: 118 organizations
STUDENTS
Attendance: 1314 students
Top majors:
- Mechanical Engineering (36.1%)
- Civil Engineering (10.4%)
- Chemical Engineering (9.3%)
UCIF Day 4
University Career & Internship Fair (UCIF) - DAY 4 of 4
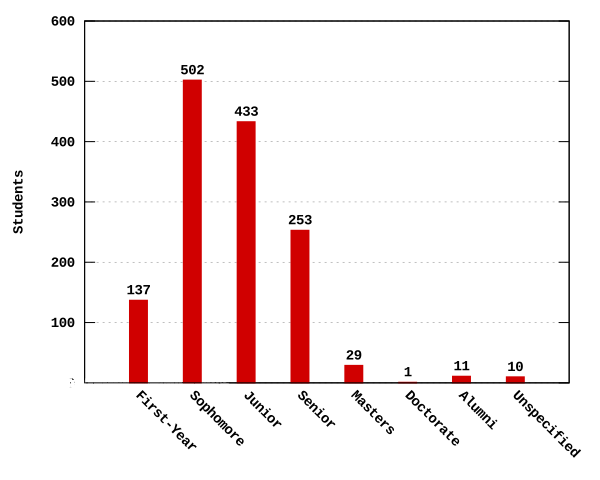
Day 4 highlights economics, banking & finance, as well as government, public administration, and law, along with community support and human services in addition to marketing and communication, human resources, sales, and management, as well as hospitality, sports, recreation, and wellness fields. Below are key statistics from the fourth day of the fair.

Thursday, September 24, 2026
11am-3 pm | Nebraska Union
EMPLOYERS
Attendance: 118 organizations
STUDENTS
Attendance: 1376 students
Top majors:
- Finance (31.2%)
- Marketing (15.1%)
- Business Administration (12.1%)
Part-Time Job Fair
Part-Time Job Fair
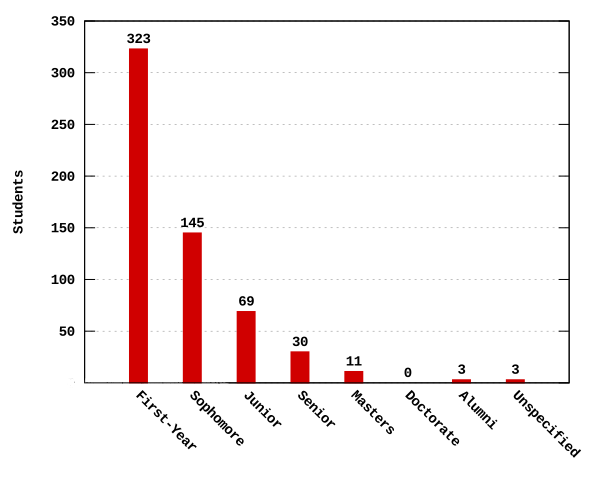
The Part-Time Job Fair is the first career event of the academic year, connecting students with local employers looking for part-time help during the fall semester. The fair is held over one day and offers students a chance to explore part-time opportunities that work with their class schedules.

Thursday, August 20, 2026
11am-1pm | Nebraska Union
EMPLOYERS
Attendance: 29 organizations
STUDENTS
Attendance: 584 students
Top majors:
- Mechanical Engineering (8.46%)
- Pre-Health (6.92%)
- Pre-Medicine (6.54%)
Education Career Fair
Education Career Fair - Meet the Districts
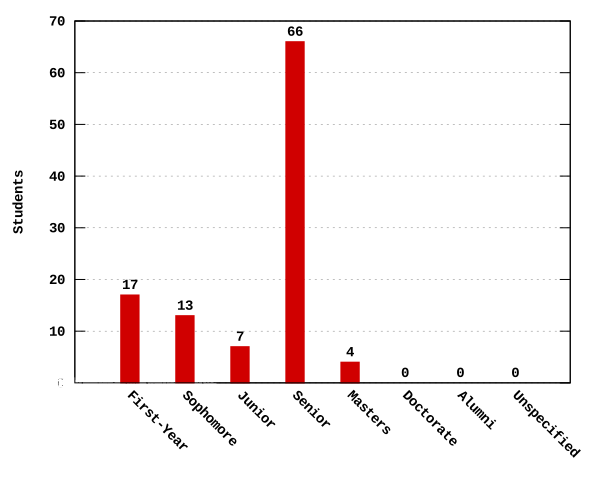
The Education Career Fair gives future educators the chance to connect with representatives from school districts. The fair is the perfect opportunity for students to learn about district openings and other education opportunities.

Tuesday, September 15, 2026
1-3 pm | Nebraska Union
EMPLOYERS
Attendance: 54 organizations
STUDENTS
Attendance: 107 students
Top majors:
- Elementary education (29%)
- Secondary education (26.2%)
- Child, Youth & Family Studies (13.1%)
Actuarial Science Career Fair
Actuarial Science Career Fair
The Actuarial Science Career Fair connects employers with highly skilled students pursuing careers in actuarial science and related fields. This event is an opportunity to engage with candidates interested in roles such as risk analysis, insurance, financial modeling, and quantitative risk management. Whether you're recruiting for internships or full-time positions, you’ll meet students with strong analytical and problem-solving abilities. Register today to connect with the next generation of actuarial professionals.

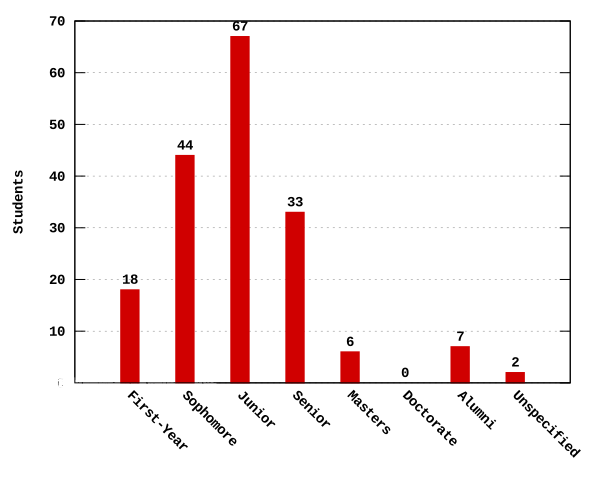
Monday, September 28, 2026
4-6 pm | Howard L. Hawks Hall
EMPLOYERS
Attendance: 29 organizations
STUDENTS
Attendance: 175 students
Top majors:
- Actuarial Science (73.1%)
- Finance (10.0%)
- Business Administration (7.5%)
Spring 2026 1268
Spring 2026 Fairs
University Career & Internship Fair (UCIF) Overview
University Career & Internship Fair (UCIF) Overview
The University Career & Internship Fair is the largest career event of the spring semester. Held over the course of five days, the fair is organized by specific career fields to help students connect with employers in their areas of interest. Here you'll find key information about the entire event as well as day-specific statistics.
February 5-12, 2026 | Nebraska Unions
249 unique organizations
320 total organization booths
2.679 unique student attendees
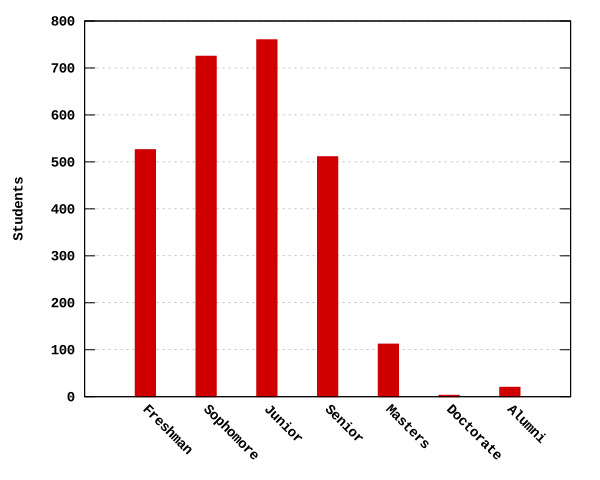
3,050 total student attendees
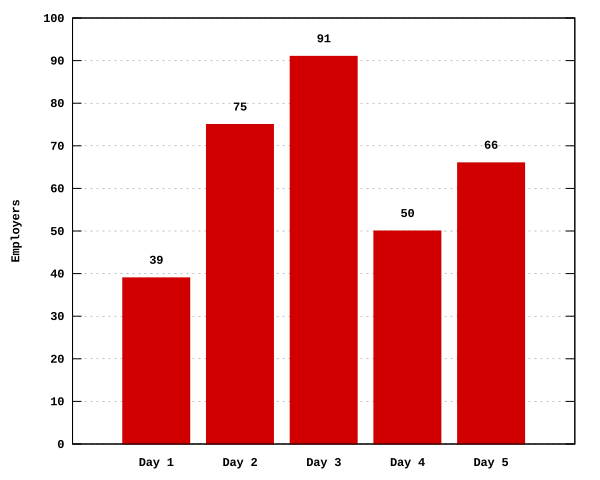
| 
| 
|
Organizations | Years | Colleges |
UCIF Day 1: Agriculture & Food Systems | Environment & Natural Resources
UCIF Day 2: Architecture & Construction | Computing, Software, and Data Analytics
UCIF Day 3: Engineering | Science, Research & Development
UCIF Day 4: Economics, Banking & Finance | Government, Policy, Public Administration & Law | Community Support & Human Services
UCIF Day 5: Marketing & Communications | Management, Human Resources & Sales | Hospitality, Sports, Recreation & Wellness
UCIF Day 1
University Career & Internship Fair (UCIF) - DAY 1 of 5
Day 1 highlights agriculture and food systems, as well as environment and natural resource fields. Below are key statistics from the first day of the fair.

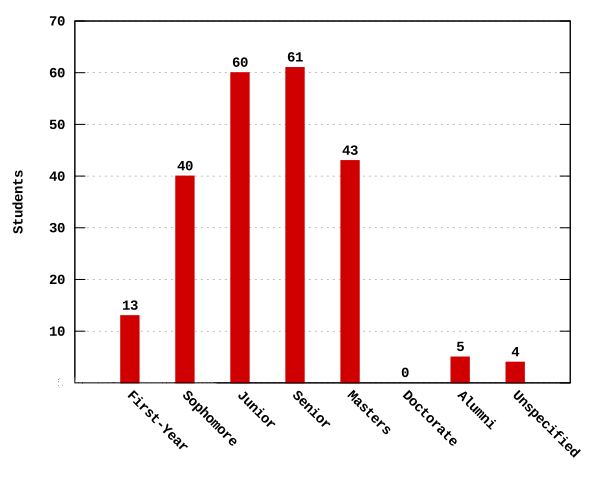
Thursday, February 5, 2026
12-4 pm | Nebraska East Union
EMPLOYERS
Attendance: 39 organizations
STUDENTS
Attendance: 167 students
Top majors:
- Agribusiness (16.7%)
- Animal Science (12.6%)
- Agronomy (7.2%)
UCIF Day 2
University Career & Internship Fair (UCIF) - DAY 2 of 5
Day 2 highlights architecture, engineering, and construction, as well as computing, software, and data analytics. Below are key statistics from the second day of the fair.

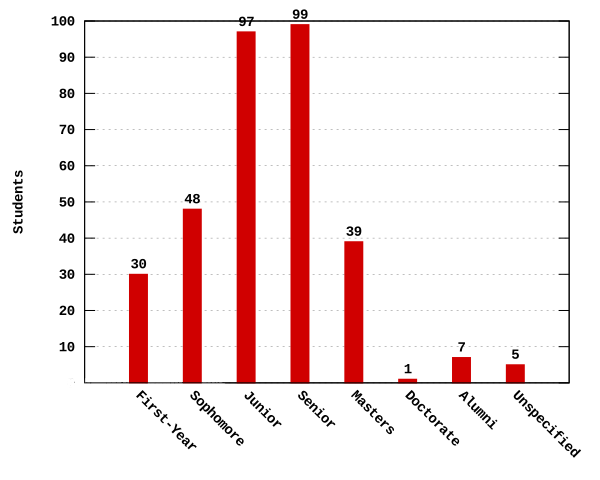
Monday, February 9, 2026
12-4 pm | Nebraska Union
EMPLOYERS
Attendance: 75 organizations
STUDENTS
Attendance: 265 students
Top majors:
- Computer Science (25.3%)
- Construction Management (14%)
- Software Engineering (13.2%)
UCIF Day 3
University Career & Internship Fair (UCIF) - DAY 3 of 5
Day 3 highlights engineering, as well as science and research fields. Below are key statistics from the third day of the fair.

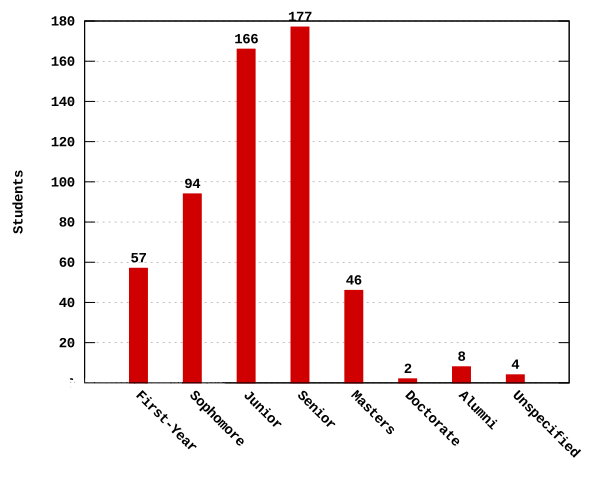
Tuesday, February 10, 2026
12-4 pm | Nebraska Union
EMPLOYERS
Attendance: 91 organizations
STUDENTS
Attendance: 459 students
Top majors:
- Mechanical Engineering (36.8%)
- Electrical Engineering (10.2%)
- Civil Engineering (8.7%)
UCIF Day 4
University Career & Internship Fair (UCIF) - DAY 4 of 5
Day 4 highlights economics, banking & finance, as well as government, public administration, and law, along with community support and human services. Below are key statistics from the fourth day of the fair.

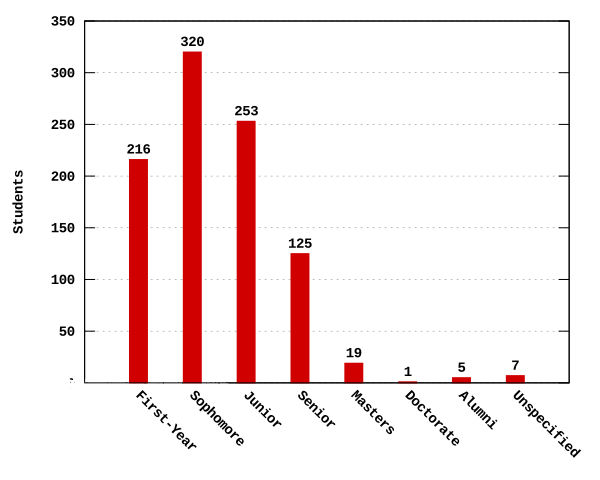
Wednesday, February 11, 2026
12-4 pm | Nebraska Union
EMPLOYERS
Attendance: 50 organizations
STUDENTS
Attendance: 810 students
Top majors:
- Finance (32.4%)
- Accounting (18.6%)
- Business Administration (14.3%)
UCIF Day 5
University Career & Internship Fair (UCIF) - DAY 5 of 5
Day 5 highlights marketing and communication, human resources, sales, and management, as well as hospitality, sports, recreation, and wellness fields. Below are key statistics from the fifth day of the fair.

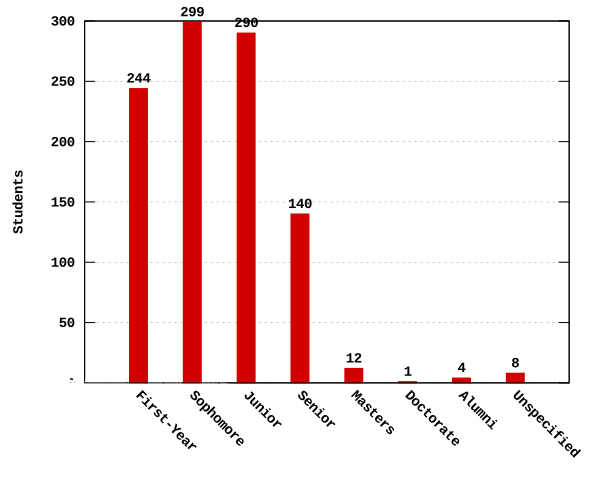
Thursday, February 12, 2026
12-4 pm | Nebraska Union
EMPLOYERS
Attendance: 66 organizations
STUDENTS
Attendance: 893 students
Top majors:
- Business Administration (22.8%)
- Marketing (21%)
- Management (14%)
Education Career Fair
Education Career Fair - Meet the Districts
The Education Career Fair gives future educators the chance to connect with representatives from school districts. The fair is the perfect opportunity for students to learn about district openings and other education opportunities.

Wednesday, February 25, 2026
1-3 pm | Nebraska Union
EMPLOYERS
Attendance: 69 organizations
STUDENTS
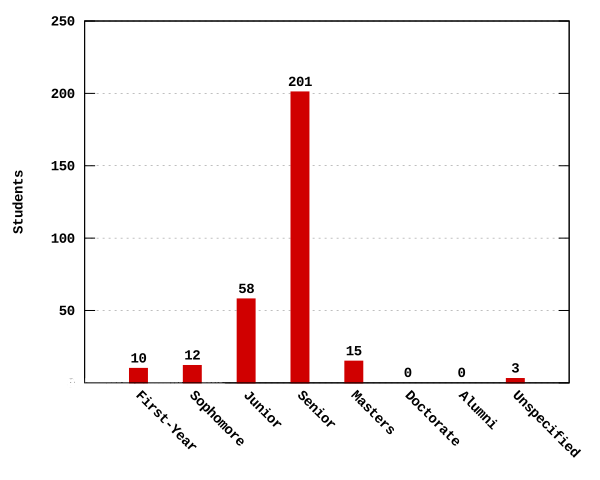
Attendance: 267 students
Top majors:
- Elementary education (32.5%)
- Secondary education (20.6%)
- Music education (6.8%)
Just-in-Time Career Fair
Just-in-Time Career Fair
The Just-in-Time Fair provides employers with a valuable opportunity to recruit for last-minute internships, jobs, and experiential roles in a casual, low-pressure setting while connecting with students still seeking summer opportunities.

Thursday, April 2, 2026
1-3 pm | Nebraska Union
EMPLOYERS
Attendance: 29 organizations
STUDENTS
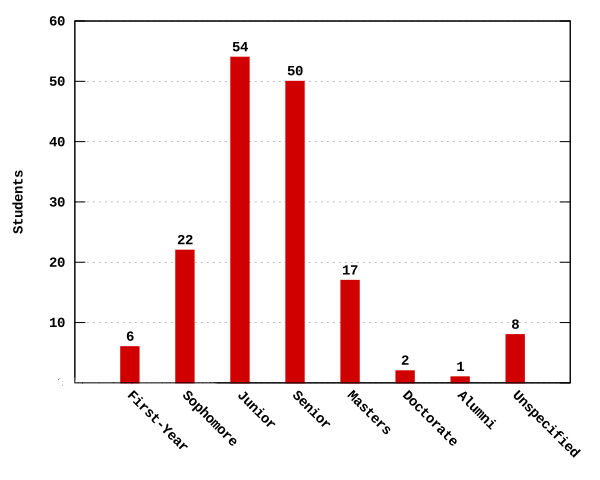
Attendance: 80 students
Top majors:
- Psychology (13.75%)
- Accounting (10%)
- Mechanical Engineering (10%)